ConceptHMI Web Help
Tools for debugging an application
ConceptHMI provides tools to help the user in application debugging. This topic explains how to use these different tools.
ConceptHmi provides a log mechanism and a default view to manage logging files. The following features are available:
The first step is to create a DataLoggingService. The DataLoggingService constructor requires the path to the log directory and wether it must force the creation of the directory.
public DataLoggingService DataLogging
{
    get
    {
        if (_dataLogging == null)
        {
            string logFolder = Path.Combine(ConceptUtilsUtils.ApplicationDataPath, "Logs");
            _dataLogging = new DataLoggingService(logFolder, true);
        }
        return _dataLogging;
    }
}
The next step is to define the desired DataLogger. There is no restriction on the number of DataLogger.
 |
To manage all application logs we suggest to create three DataLoggers :
|
public DataLogger ErrorLogger { get; private set; }
public DataLogger DebugLogger { get; private set; }
public DataLogger InfoLogger { get; private set; }
To work correctly, the log mechanism must be initialized before use and finalized to save and release the log files. If FinalizeLog method is not called, the application will not stop correctly because the DataLoggingService thread(s) will still be running.
private void InitializeLog()
{
    ErrorLogger = new DataLogger(DataLogging, "Error", DataLoggerMode.FilePerDay);
    InfoLogger = new DataLogger(DataLogging, "Info", DataLoggerMode.AppendFile);
    DebugLogger = new DataLogger(DataLogging, "Debug", DataLoggerMode.RewriteFile);
    DataLogging.Load();
}
private void FinalizeLog()
{
    DataLogging.Save();
    DataLogging.Terminate();
}
The use of log mechanism is very simple. Access to the desired DataLogger and call its method WriteLine to write a text in the associated log file.
ErrorLogger.WriteLine("Text to write");
Concept provides a control to configure loggers and manage logging files. This view enables you to change the following settings of the logging service :
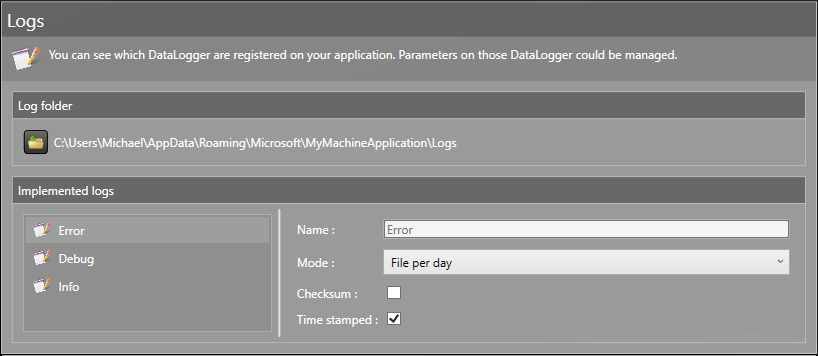
To add this view to your application, use the ConceptLogsView control and simply bind the DataLoggerProvider to the DataLoggingService.
<concept:ConceptLogsView DataLoggerProvider="{Binding Path=DataLogging}"/>
oStudio is a software developed by Objectis which provides tools to do live debugging and real-time tuning on C# software and WPF applications. To establish a connection between oStudio and your application, you must implement a communication server in your application. In our case, we will implement an OCF server. OCF stands for Objectis Communication Foundation, it is an efficient and lightweight communication protocol developed by Objectis.
Before starting the server implementation, you must add the following references to your project :
|
You can find OCF DLL in Concept release. |
To set up an OCF server, you must create a DynamicInvocationServerTcp with its name and port as parameters. Then you must create an InvocableReflectorConcept, this class provides mechanisms to inspect a Concept object by reflection. The final step is to start the thread which will respond to the invocations. All these steps are made by the StartConceptOcfServer method. This method requires a ConceptContainer as parameter, this ConceptContainer will be the starting point to inspect the concept data model. The StopConceptOcfServer method stops the server thread and disposes the OCF server.
|
The second parameter of new InvocableReflectorConcept(rootContainer, InvocationAccess.Public) defines the elements (Variables, properties and methods) accessible by invocation. The following choices are possible :
|
public void StartConceptOcfServer(ConceptContainer rootContainer)
{
    _terminating = false;
    _server = new DynamicInvocationServerTcp(_serverName, _serverPort);
    _invocable = new InvocableReflectorConcept(rootContainer, InvocationAccess.Public);
    Thread thread = new Thread(ServerThread);
    thread.Start();
}

public void StopConceptOcfServer()
{
    _terminating = true;
}

private void ServerThread()
{
    while (!_terminating)
    {
        if (_server.WaitInvocation(TimeSpan.FromMilliseconds(1)))
            _server.ExecuteInvocation(_invocable);
    }
    ((IDisposable)_server).Dispose();
}

private IOcfServer _server;
private IInvocable _invocable;
private bool _terminating;
private string _serverName = "ServerName";
private int _serverPort = 10000;
With LiveTuning, observing and interacting with a system can easily be done while it’s running. It provides the following features :
|
You can download the oStudio installer here: http://www.objectis-software.com/download-ostudio-2013/ |
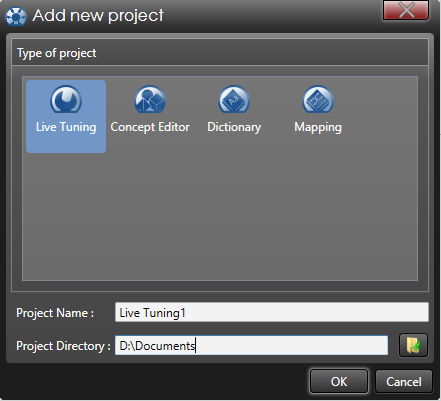
First you must create a new oStudio - Live Tuning project, go to file menu, new and project (Ctrl + N). Then choose Live Tuning as project type, define the project name and his location. Validate with OK.
When the Live Tuning project is created, you must connect to the application server. To do so, add a new connection of type Fast Native Tcp and configure it.

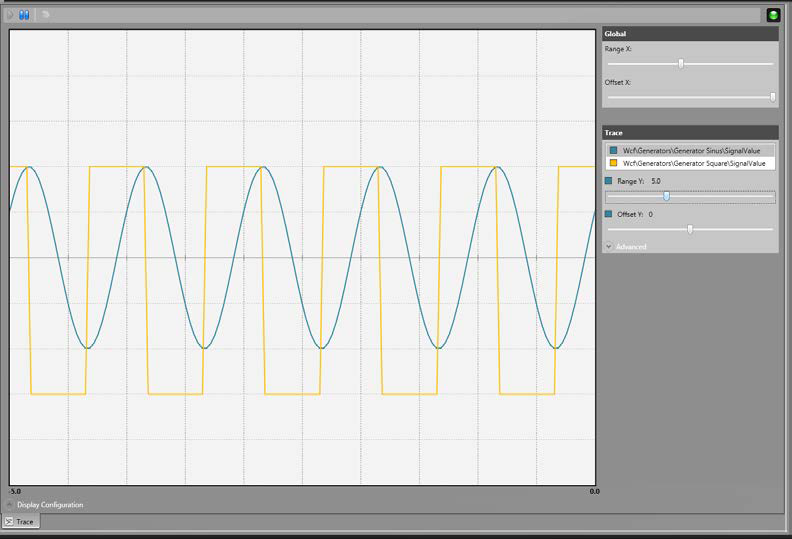
You can now work with oStudio - Live Tuning and use all the features of this tool. In this topic, we will work with the Trace tool. The Trace tool is an oscilloscope. You can add variables to plot their values in live. To add a Trace tool, go to Live Tuning menu and select Add Trace. To add a variable, you can simply drag it and drop it inside the window.
|
For more information on Studio – Live Tuning see the online user guide : http://www.objectis-software.com/support/ostudio-live-tunings-user-guide/ |
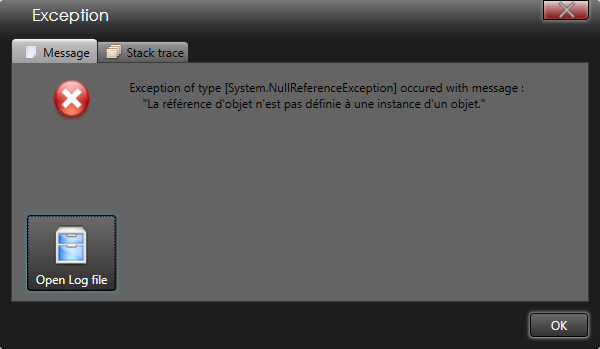
The ConceptBootstrapper class offers unhandled exceptions management. In order to know when an unhandled exception is raised, objects of this class subscribe to the following events :
When an unhandled exception is raised, the bootstrapper will show a window describing the exception and write it to the error log file. With this window, the user will have further information to find the cause of the exception.