
Welcome on the oStudio – Live Tuning’s User Guide. This post will help you to get started with oStudio – Live Tuning, from the installation to use instructions.
You can also get the PDF here.
Here is the contents:
- Installation
- oStudio – Live Tuning
- Creating a projet
- Connection
- Monitoring area
- General
- Watch
- Trace
- Dropbox
- Log
- Console
- Script
- Troubleshooting
Let’s begin!
1. Installation
Run the installer that you can download here.
Follow the steps until the installation is completed.
Then launch oStudio.
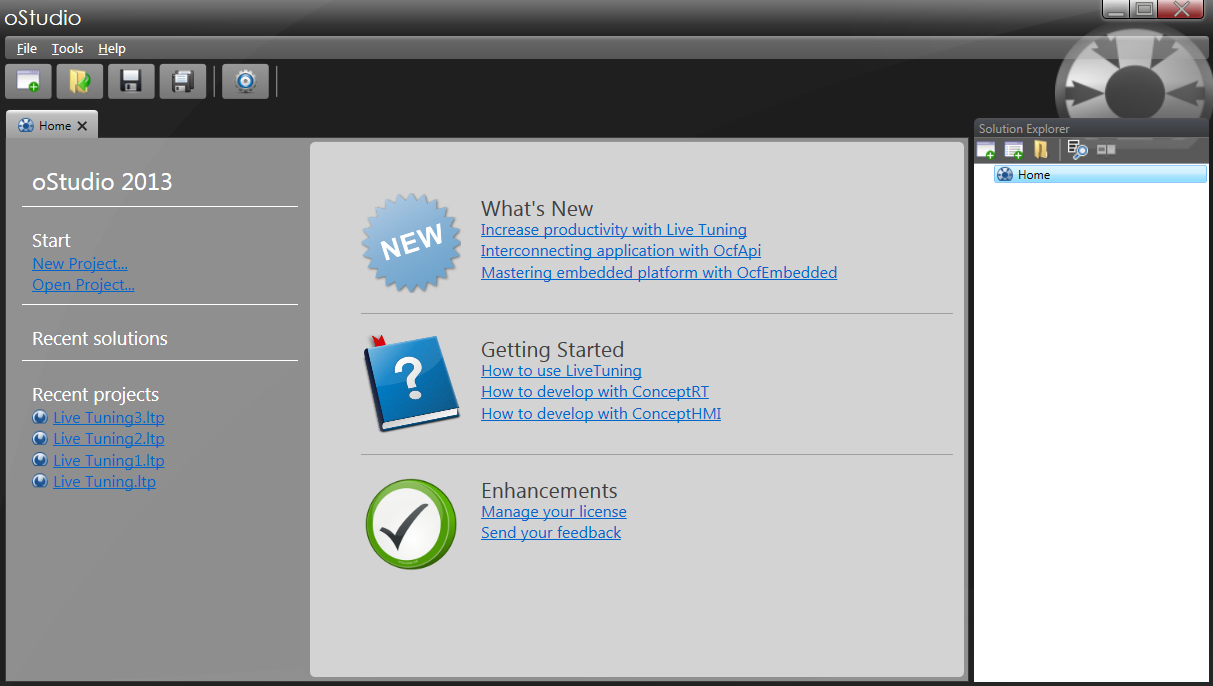
2. oStudio – Live Tuning
2.1 Creating a projet
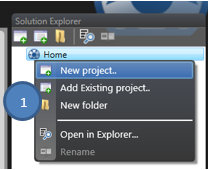
First you must create a new oStudio – Live Tuning project :
- Right-click on Solution -> New project…
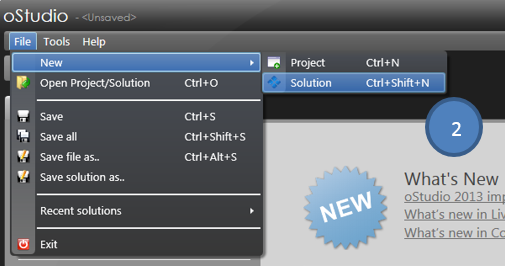
- File -> New -> Project (Ctrl+N)
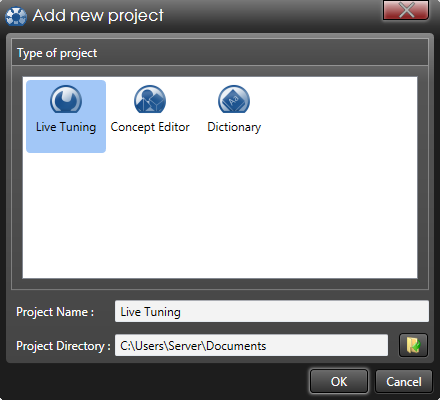
Then choose Live Tuning as project type, define the project name and his location. Validate with OK.
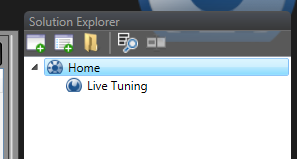
Your new project is now visible in the solution explorer. Naturally you can add as many projects as you need.
2.2 Connections
2.2.1 Connections explorer
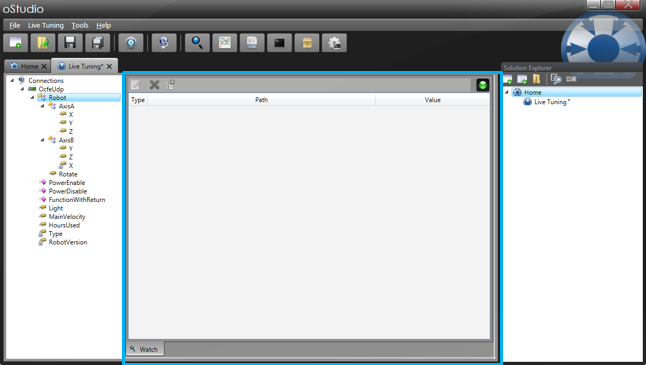
To left of oStudio’s window, you can find the connections and objects explorer of oStudio – Live Tuning. Here you can navigate through connections, variables, objects and interact with them.
2.2.2 Add a connection
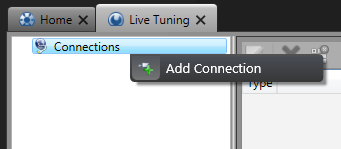
Now you must add a connection to your server (Ocf Embedded or Ocf).
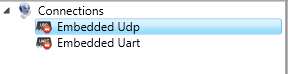
Right click on Connections -> Add client
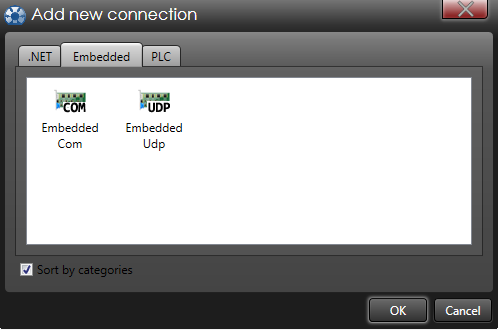
Select the type of connection.
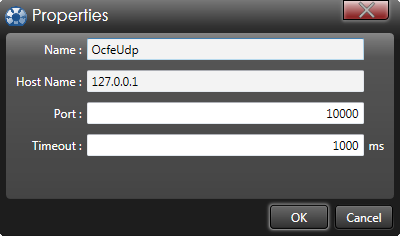
And configure it.
Finally you are connected with the selected server. You can explore the entire tree of variables and objects published by the target.
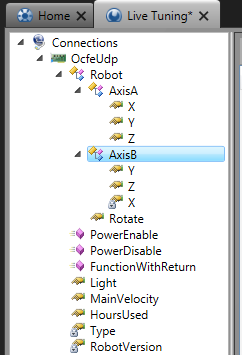
If a connection is down, a little red dot appears over the bad connection. Various reasons can produce it :
- Unable to open serial port (already used by another program, physically disconnected…)
- Remote server is not running
- Bad udp port selected or blocked by the firewall
- …
3. Monitoring area
3.1 General
3.1.1 Add a monitoring window 1
In the center of oStudio’s window, there are the different monitoring areas described below. You can add, remove, and resize them.
By default, a Watch window is added and ready to use. Naturally you can add as many windows as you need.
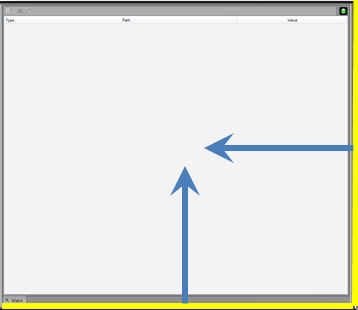
The monitoring area is divided in one, two or four sub-area for better ergonomics and visibility. Two light bars are located on the right and the bottom of the first sub-area, they are draggable to manage sub-areas number and size.
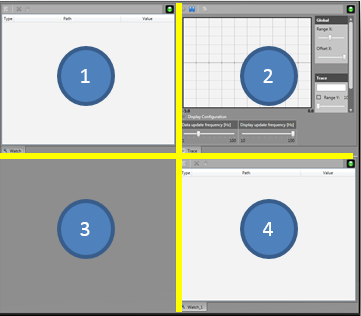
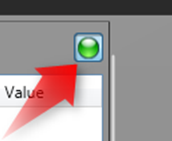
Each window has an option to freeze the window state, you can activate/disable each window separately by clicking on the led button at the right-top.
3.1.2 Add a monitoring window 2
To add a monitoring window in an area, there are three ways:
- In oStudio – Live Tuning
- In toolbar
- With a right-click on a sub area
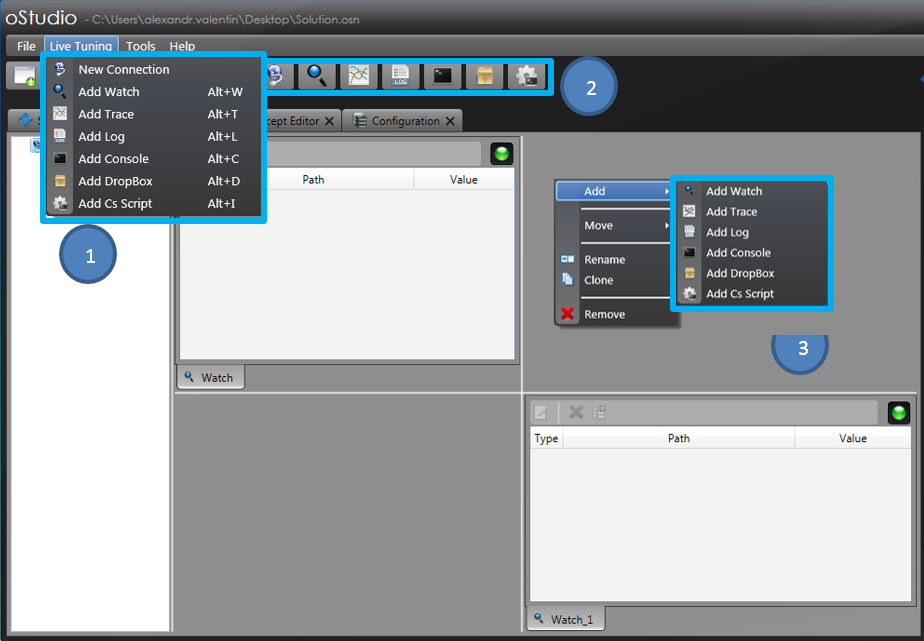
Then choose the monitoring tool you need.
Each monitoring tool tab can be renamed with a right-click on the tab name and selecting Rename. You can change it as you want.
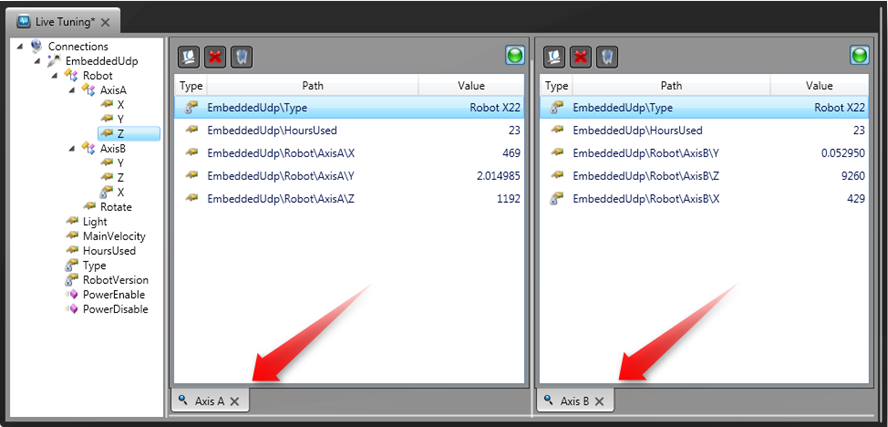
3.2 Watch
3.2.1 Features of the watch monitoring tool
Add, delete, sort, group all target variables directly from oStudio. Observe and edit them live, without disturbing the process. Call functions and methods asynchronously.
3.2.2 Add a spy
To observe a variable value in a watch window you just have to drag and drop it. Then the variable is logged with its full path and you can watch its value.
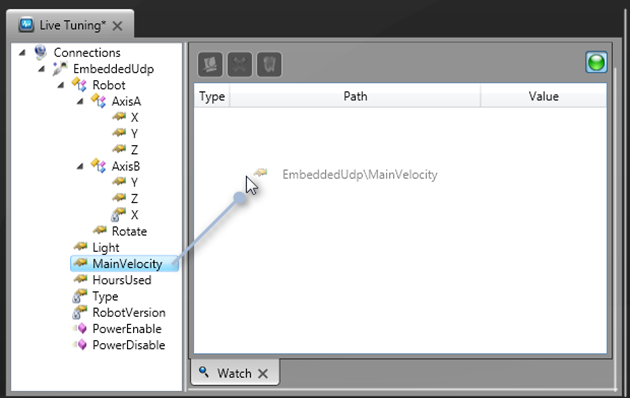
You can use different watch windows to separate the shown variables by category.
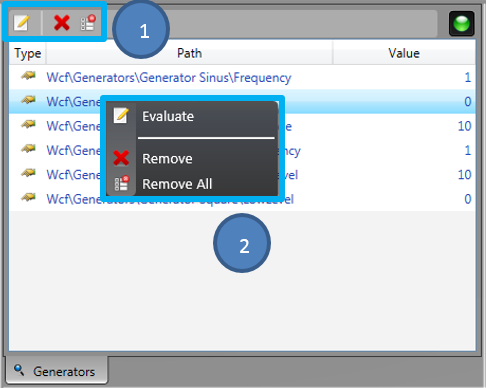
3.2.3 Spies opions
You can delete, move or evaluate any entries in a watch window with a right-click on the entry or by selecting the entry and using the toolbar on the top.
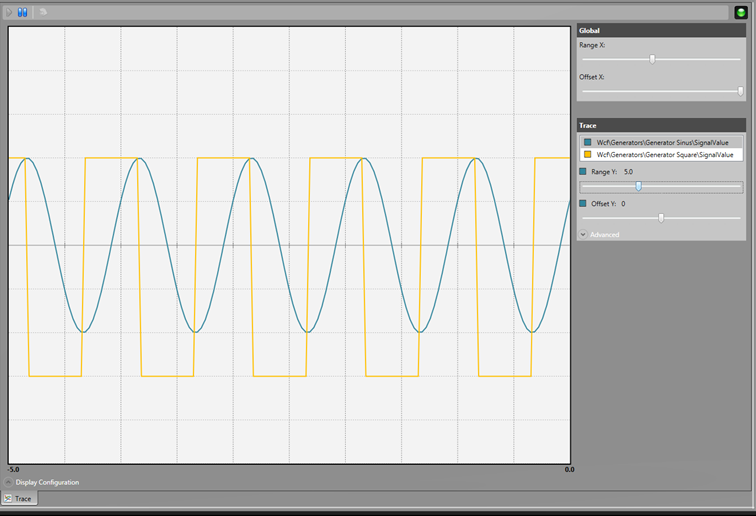
3.3 Trace
3.3.1 Features of the trace monitoring tool
The trace tool is an oscilloscope. You can add variables to plot its value. They are plotted live.
3.3.2 Add a trace
To add a variable, you simply have to drag and drop it inside the window.
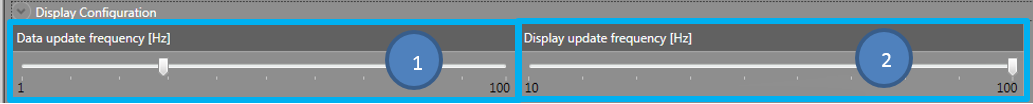
3.3.3 Display configuration
There are two options for configuring the display to get the best of it.
If you click on ![]() , you access the display options panel where you can :
, you access the display options panel where you can :
- Set the data update frequency (frequency to get data on target)
Useful to lower target charge - Set the display update frequency (frequency to refresh oscilloscope)
Useful with a low performance computer
3.3.4 Trace options 1
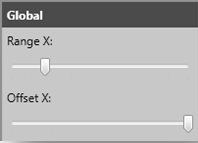
3.3.4.1 Global
You can set global parameters to manage the range and the offset of time.
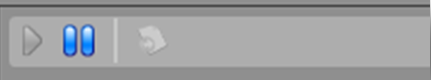
3.3.4.2 Toolbar
You can play and stop the trace to analyze the graph. You can export trace data in .csv format (only available if paused).
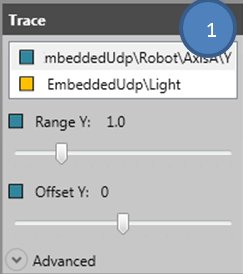
3.3.5 Trace options 2
- You can change the range and the offset for each trace by selecting the trace in the list and sliding the appropriate bar.
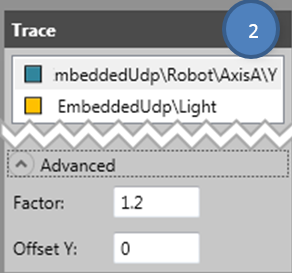
- If you open advanced options you can precise the numerical value of the factor applied on Range Y slider and offset added on Offset Y slider.
3.4 Dropbox
3.4.1 Features of dropbox monitoring tool
It’s the most appropriate tool to watch a variable one time and keep this value visible.
You can clear the dropbox by a right-click or with the tool button on top.
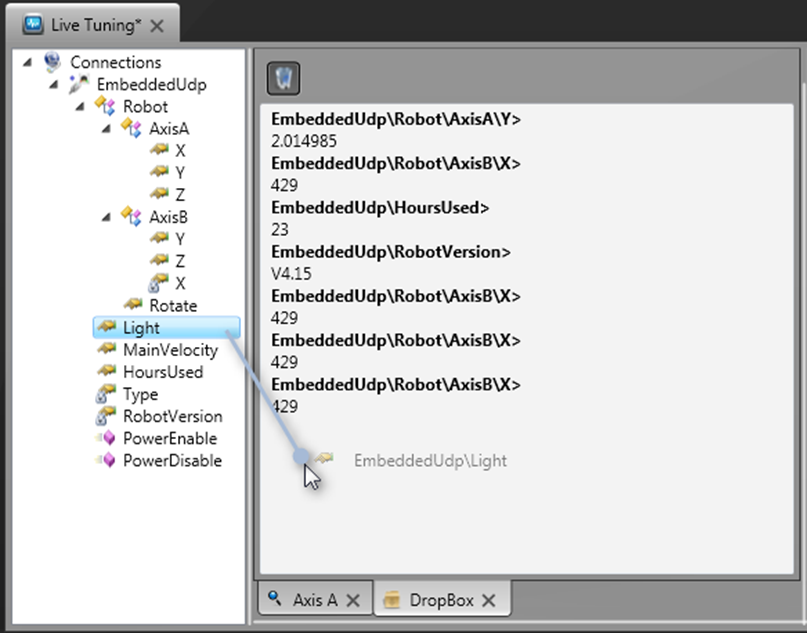
3.4.2 Variable evaluation
To evaluate a variable in dropbox, simply drag and drop it into the window. Then you can show this instant value.
You can repeat the operation as many times as needed. And add as many variables as needed.
3.5 Log
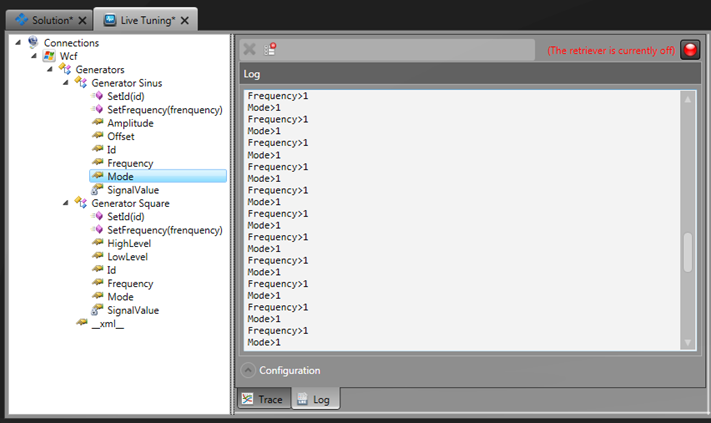
3.5.1 Features of log monitoring tool
The log window allows to log any variables, keeping the older values. You can add as many variable as needed.
3.5.2 Add a variable to log
To add a variable to the log, simply drag and drop them inside.
3.5.3 Log configuration
The log can be configured depending on your needs. Open the configuration panel by clicking on ![]()
Then you have three options
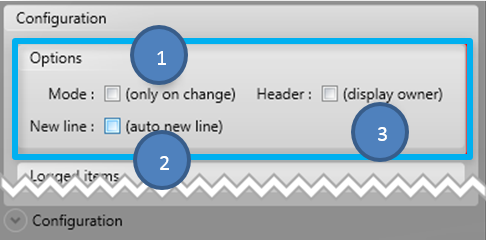
- If checked, the value is refreshed only when it changes
- If checked, after each new log a new line is inserted
- If checked, show the entire path of the variable
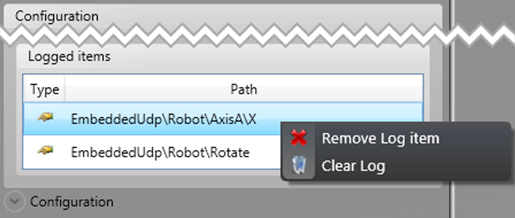
Each variables logged is listed on bottom. You can remove them with right-click -> Remove Log item
3.6 Console
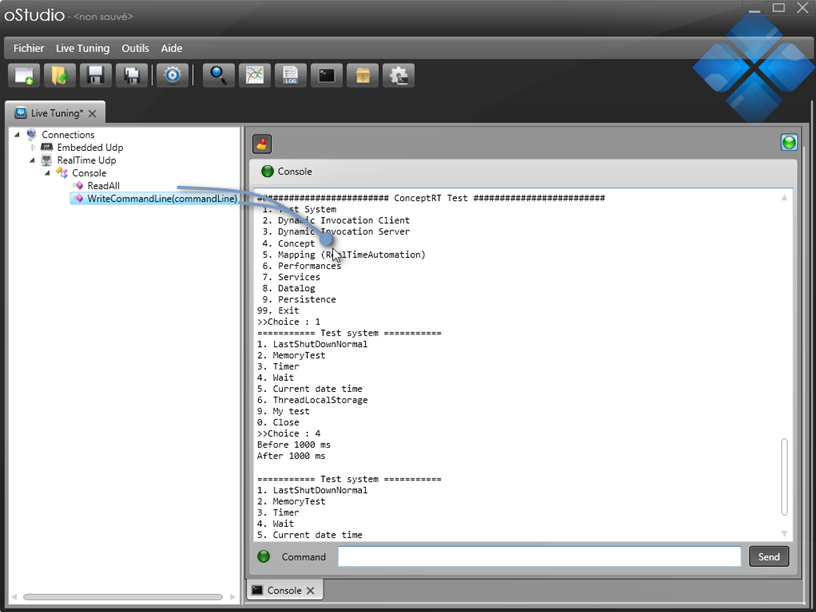
3.6.1 Features of the console
This is a console tool with which you can work on your target as a locally console program. There is a report part where you can see the information from target (1) and a send part where you can send command to the target (2).
3.6.2 Consoles configuration
You have to drag and drop the two console methods into the console (ConsoleWriteLine & ConsoleReadLine). Then you can use the console by sending command and reading return information (console is not yet available with Ocf Embedded).
3.7 Script
3.7.1 Features of script
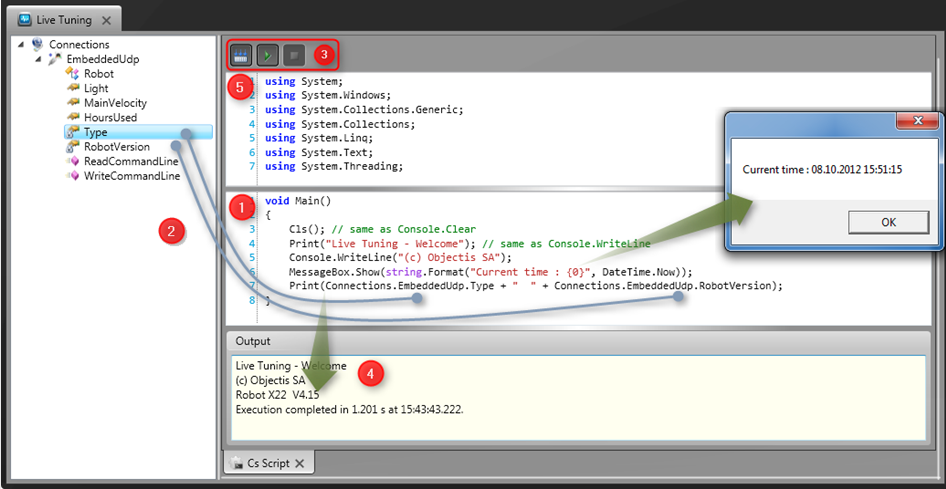
The script tool allows to program a C# script which can integrate methods and variables from the target. You can simulate a process, configure a target, print periodically information, print variables or more information to a file etc.
3.7.2 Script using
- In the main part is the C# scripting area, you can create your script. There is a main method wherein you have to work.
- You can call any function or variable of any target simply by drag and drop it in the script area. Each parameter or value must have a string representation.
- You may compile the script and play, interrupt or abort it with the control button. Warning : Aborting a script may cause resource leaks.
- You can show information in the output part of script tool. It reports the Console writing and the compilation results.
- If you open the upper flap, you can add more using libraries.
4. Troubleshooting
By executing the command Restore parameters in Program Files -> oStudio -> Tools, you’ll restore all default parameters of oStudio.


