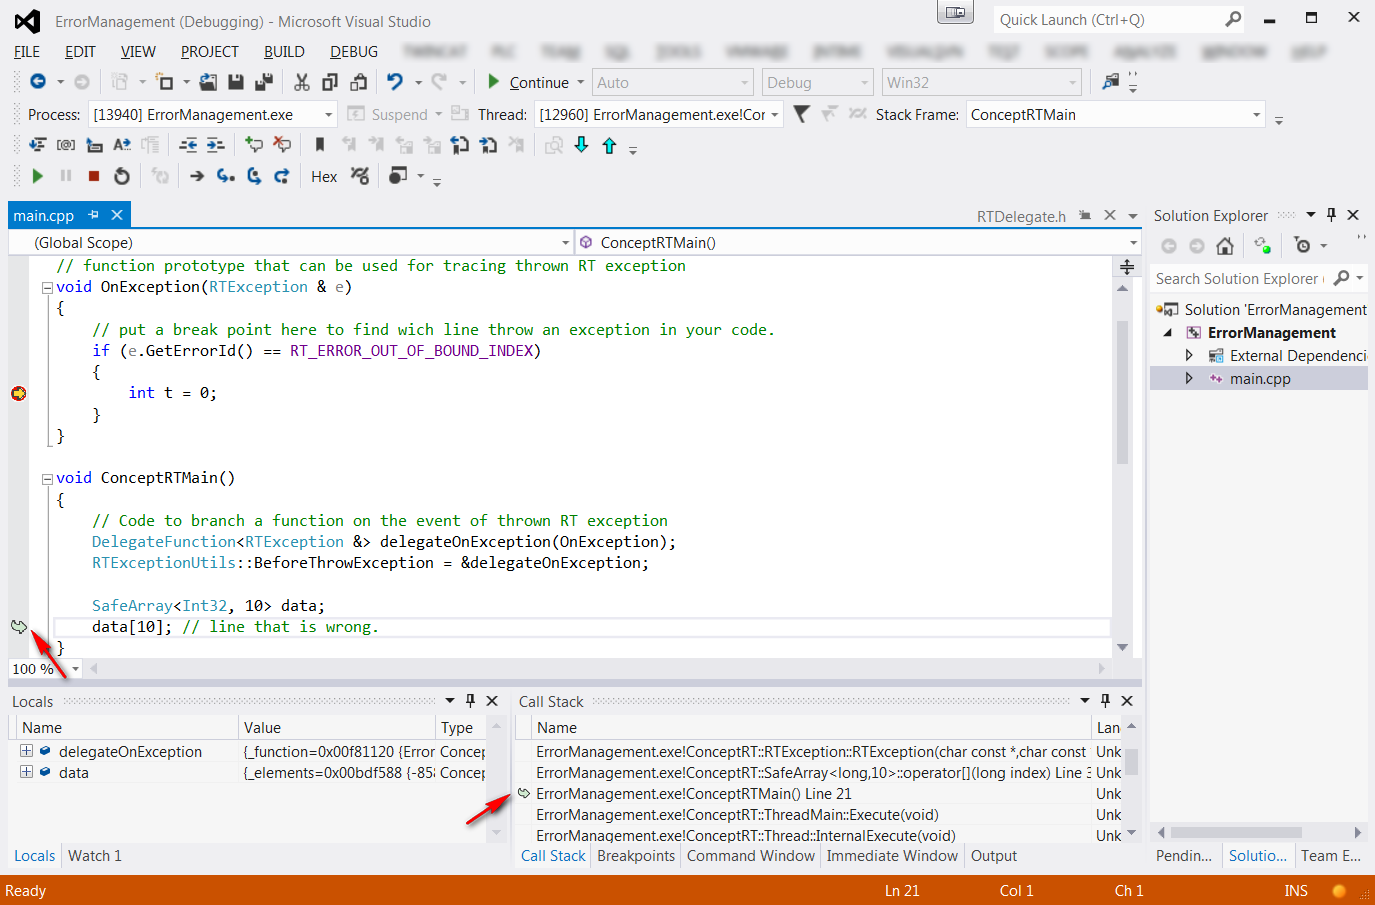
ConceptRT exception mechanism enables us to diagnose the source of an error.
By default (without try...catch block) a wrong code such as :
would print out the following message on the console :
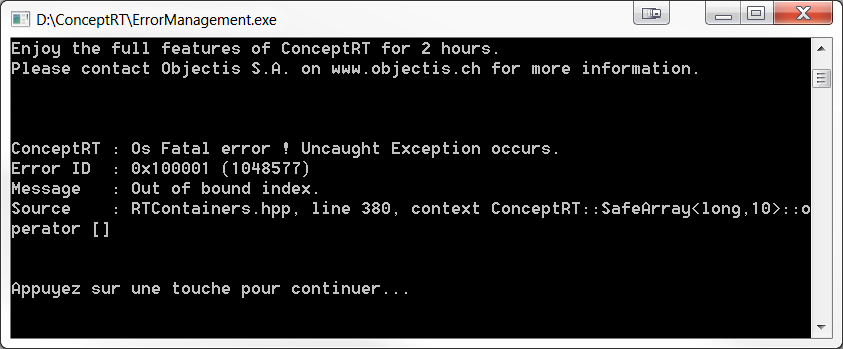
As shown in the console, the Error ID, a message and the throw line context help to find out what could be the source of the error.
It could be useful to see the stack trace to find which line in your application is causing the error. There are two ways to do that:
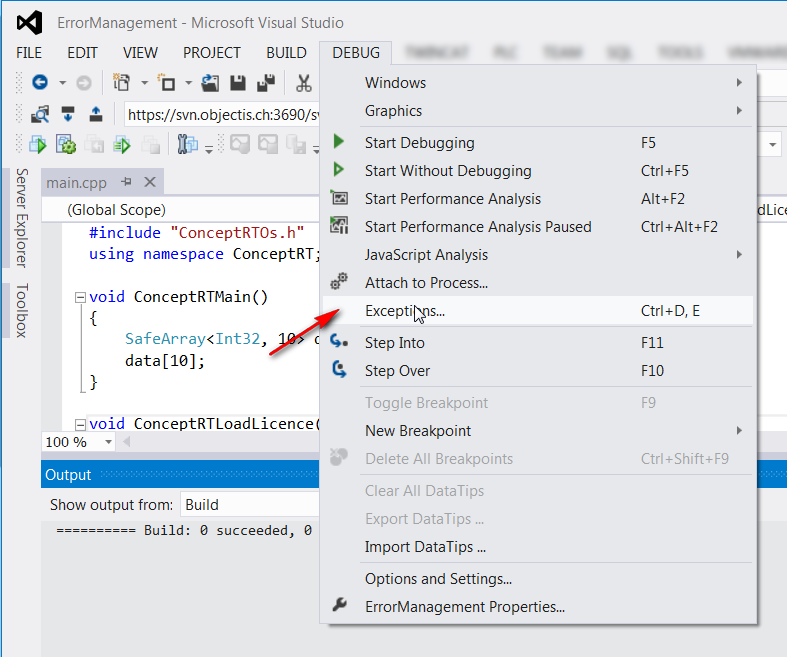
Visual Studio offers an exception detection mechanism to break your application where a line is throwing an exception. In order to activate this mechanism open the exceptions menu :
Then activate the C++ exceptions detection :
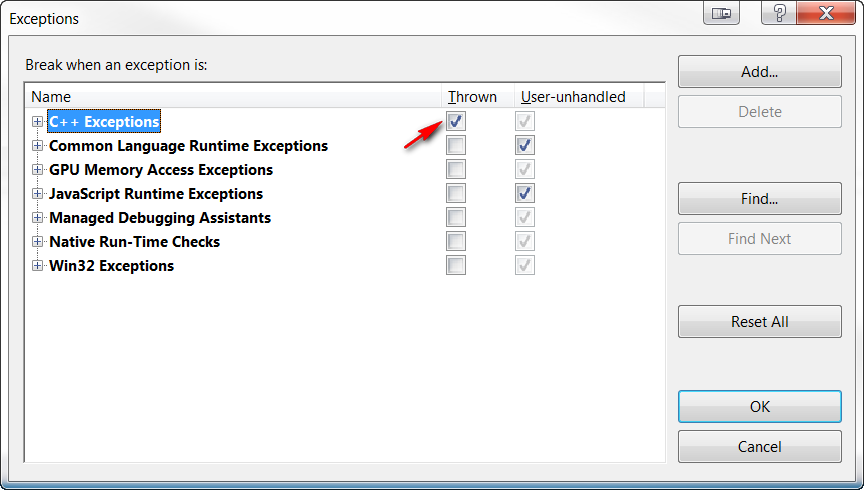
Once the application is launched in debug. The following window appears :
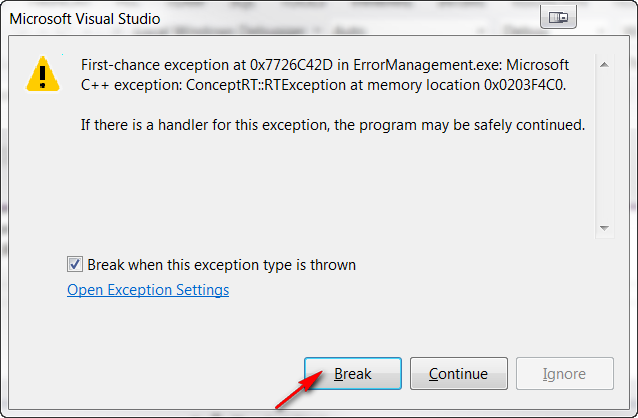
Break can be done in order to see the stack trace :

A function or method can be branched to the exception mechanism. By this approach a break point can be put to see the stack trace. Moreover it is possible to filter on a specific error ID.
This is an example of function that can be branch :
With the following code in your application the function or method can be branched to the mechanism.
Once the code launches in debug with a break point, the application will stop on the line that causes the error.
